EchoVantage Dashboard Offerings
EchoVantage dashboards are designed to provide agencies with increased visibility and insight into key areas to support decision-making and insights about themselves as an organization. Data is extracted from EchoVantage (and other data sources) and transformed to help agencies discover more about their work, their clients, and their staff. Each dashboard contains multiple pages filled with insightful visualizations. Features include the ability to drill in to learn more, export data, extensive filtering, a mobile app, and more. A description of each core dashboard included with EchoVantage is listed below, as well as the additional dashboards available through the dashboard catalog. The catalog dashboards are available for an annual fee depending on the complexity of the dashboards. An agency may also choose to subscribe to the catalog, which grants access to all dashboards currently in the catalog and any added in the future. Please contact your account manager or dashboard@echobh.com for more information.
Navigating this Page
Use the links below to access additional information about each dashboard, including a description, screenshots, and a short video. You can access the same information by scrolling down this page or using Ctrl+F to search for something specific.
Dashboards Included with EchoVantage
The dashboards included in EchoVantage explore opportunities for growth, efficient service delivery, documentation, and intervention effectiveness. As with all our dashboards, each dashboard consists of a series of pages containing multiple graphs and endless ways to slice and dice the data. For those wanting to dig in even further, an expanded version of each is also available in our catalog that includes additional functionality. For example, the Admissions Plus dashboard includes information around referral sources, days to service, and prior enrollments, along with program enrollment demographics. The Documentation Plus dashboard includes events where services were not created, and the Services Plus dashboard explores claim and charge status information. The Outcomes Plus dashboard includes time in care and re-enrollment, along with program discharge demographics. Finally, the Open Enrollments Plus dashboard includes information about how long clients have been in care, how long it took to receive services, and how long it's been since their last service.
Dashboard Catalog
Echo is continually enhancing and adding to the dashboard catalog. These dashboards are available for an annual fee depending on the complexity of the dashboards. You may also choose to subscribe to the dashboard catalog which allows access to all dashboards in the catalog. We can customize these dashboards for you, and if you don’t see something that meets your needs here, just let us know and we can discuss our custom dashboard solutions as well. Please contact your account manager or dashboard@echobh.com for more information.
- Client Engagement
- PHQ-9
- Staff Productivity
- Incidents
- Revenue Cycle Management
- Medication Management
- Medication Administration
- Placements
- Hospitalization
- Individual Trends & Progress
- Contracted Services
- Child & Adolescent Needs and Strengths (CANS)
- Social Determinants of Health
- Adverse Childhood Experiences (ACEs)
- Form Signatures
- Outstanding Alerts
- DLA-20
- GAD-7
- Form Compliance
Additional information and more in-depth screen images are available for dashboards with blue hyperlinks to the right of the name - Watch Video or View Screenshots. Right-clicking the link and selecting Open link in new tab or Open link in new window, prevents navigating away from this page in error.
Dashboards Included with EchoVantage
Admissions Watch Video View Screenshots
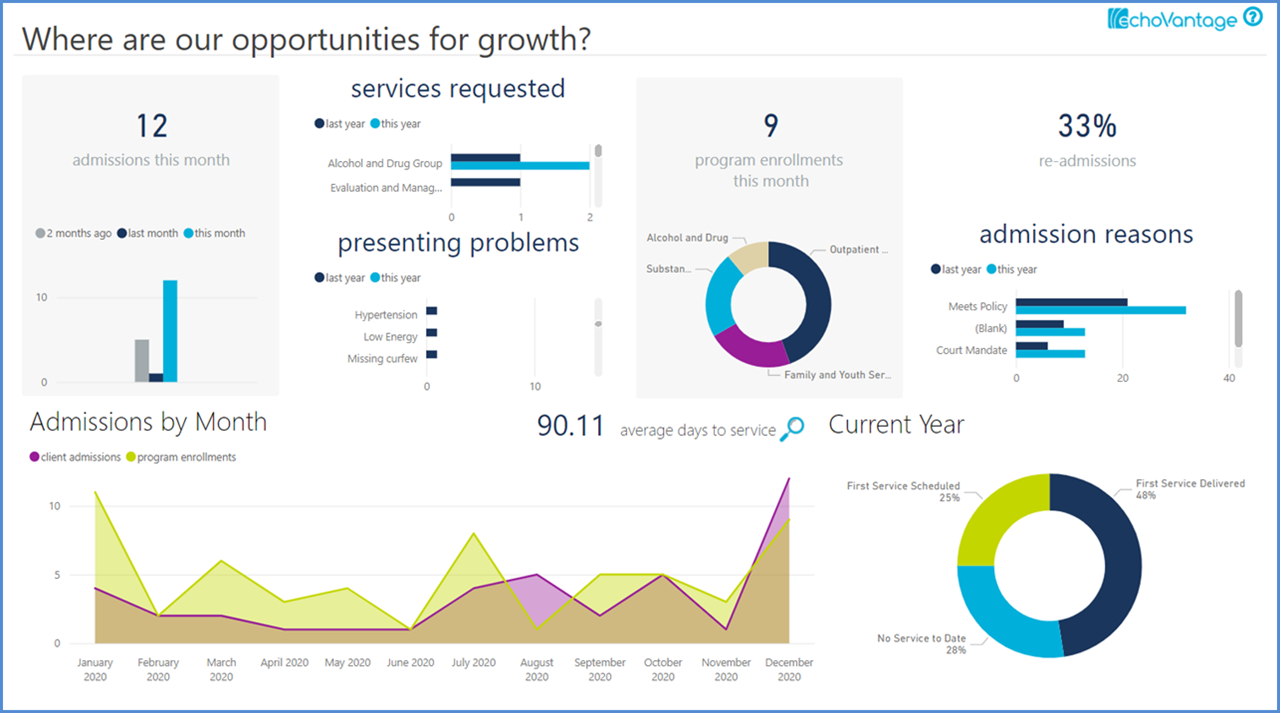
Our Admissions dashboard focuses on helping agencies discover opportunities for growth in their organization. Beyond numbers and percentages of admissions over time, the dashboard reaches further to incorporate characteristics of clients coming into care, whether these are clients your agency has worked with in the past, the services they have requested, presenting problems, and whether services have been initiated.
Services Watch Video View Screenshots
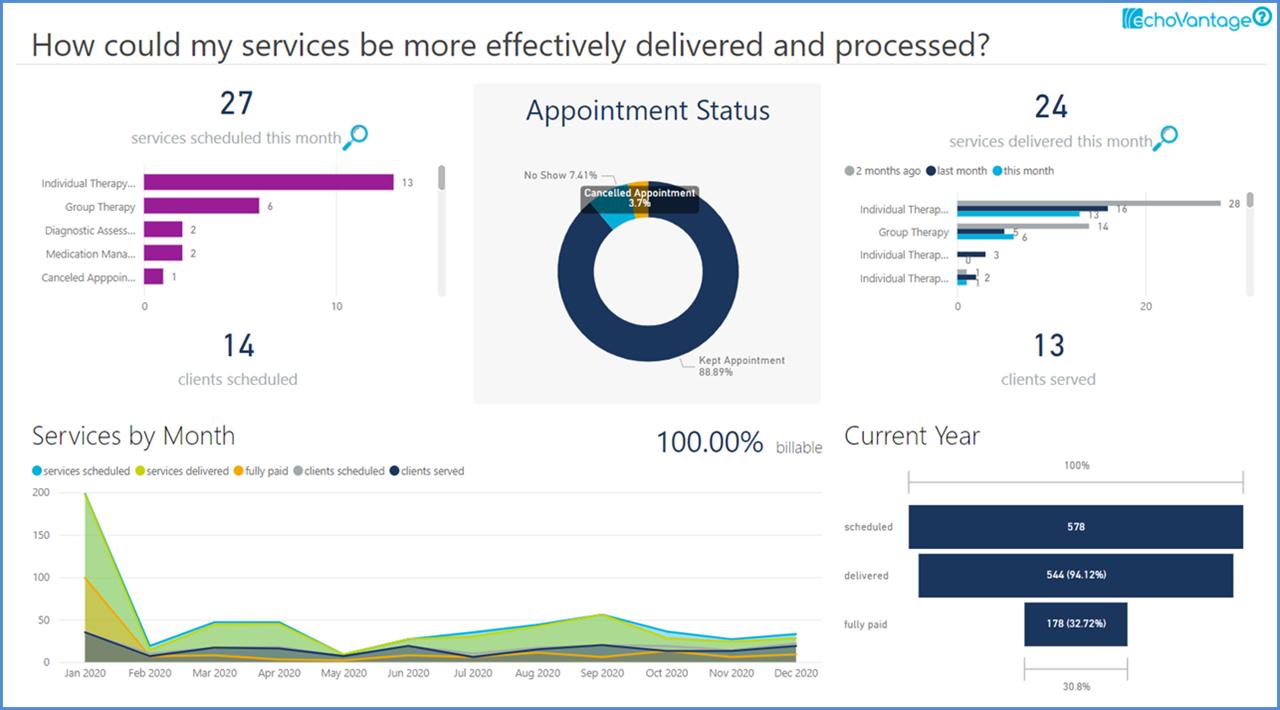
The Services dashboard reviews data that covers the process of serving clients, from appointment scheduling through service delivery. The visualizations cover not only services that were delivered and the clients who were served, but also appointments resulting in no-shows and cancellations. Staff productivity can be reviewed in terms of services provided, service duration, and clients served by staff.
Documentation Watch Video View Screenshots
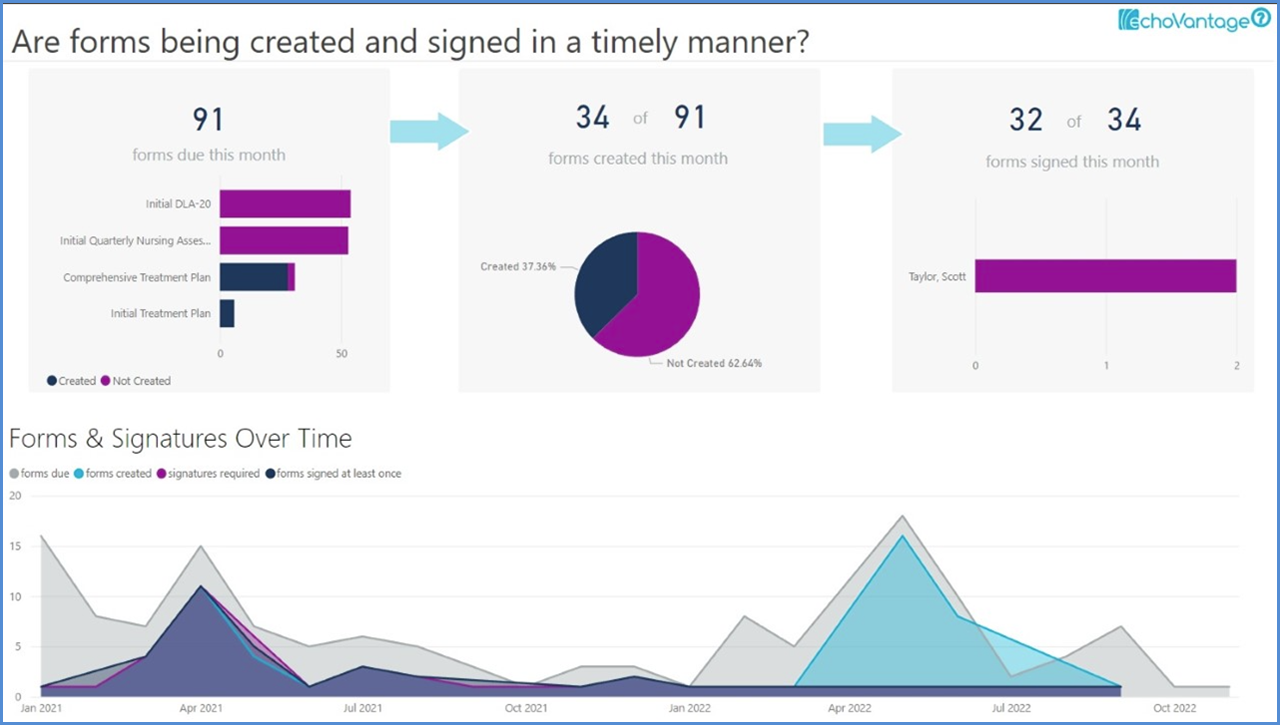
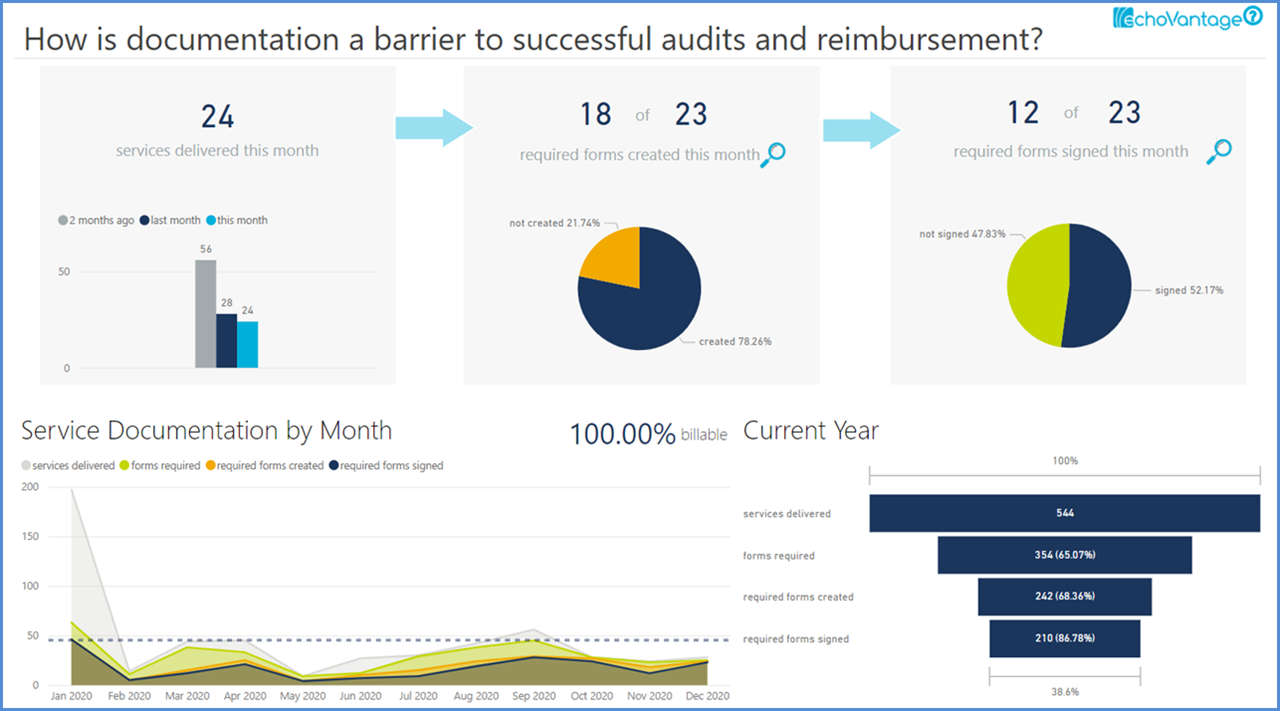
The Documentation dashboard is designed to help agencies identify barriers to successful audits and timely reimbursement for services delivered. Graphs guide users to required forms that have not yet been created or are missing necessary signatures. It also provides information around delay of completion for service documentation in days and hours.
Open Enrollments Watch Video View Screenshots
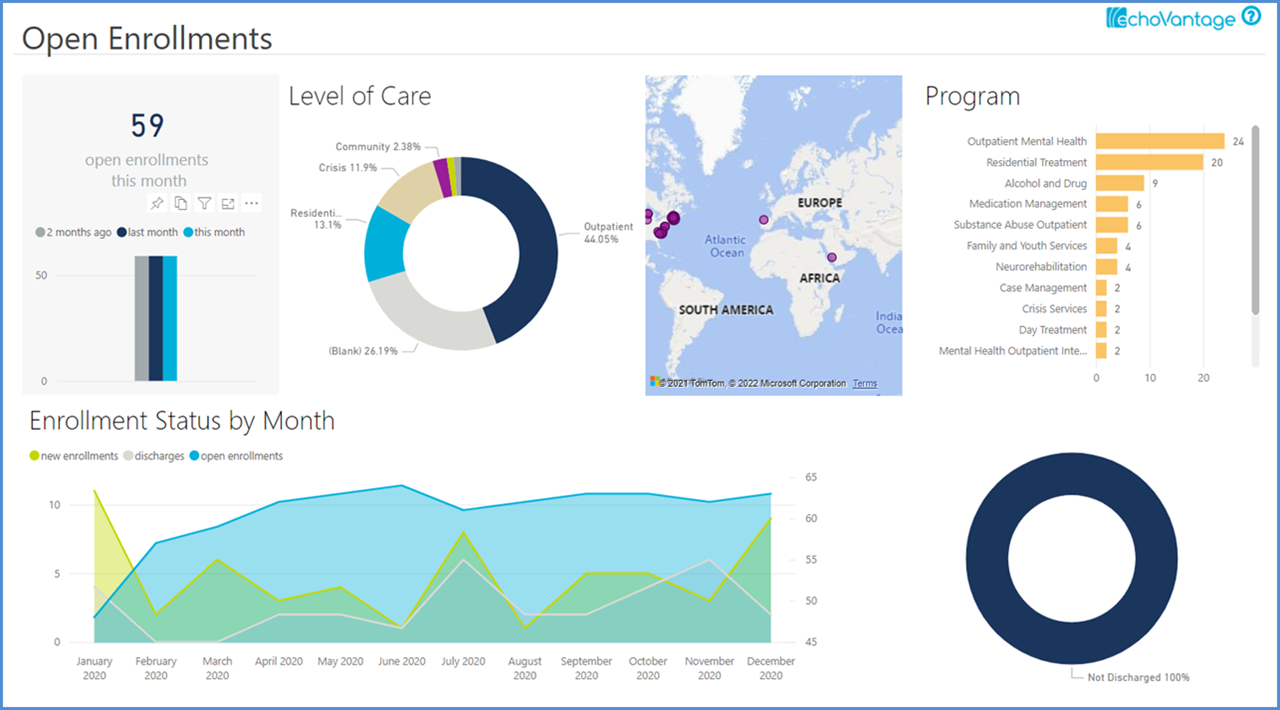
Our Open Enrollments dashboard gives users a sense of the agency’s current census, breaking the information down by level of care, program, primary, payer, and client demographics, for example. Users can choose a specific time frame to view a set of clients as a cohort and review their data.
Outcomes Watch Video View Screenshots
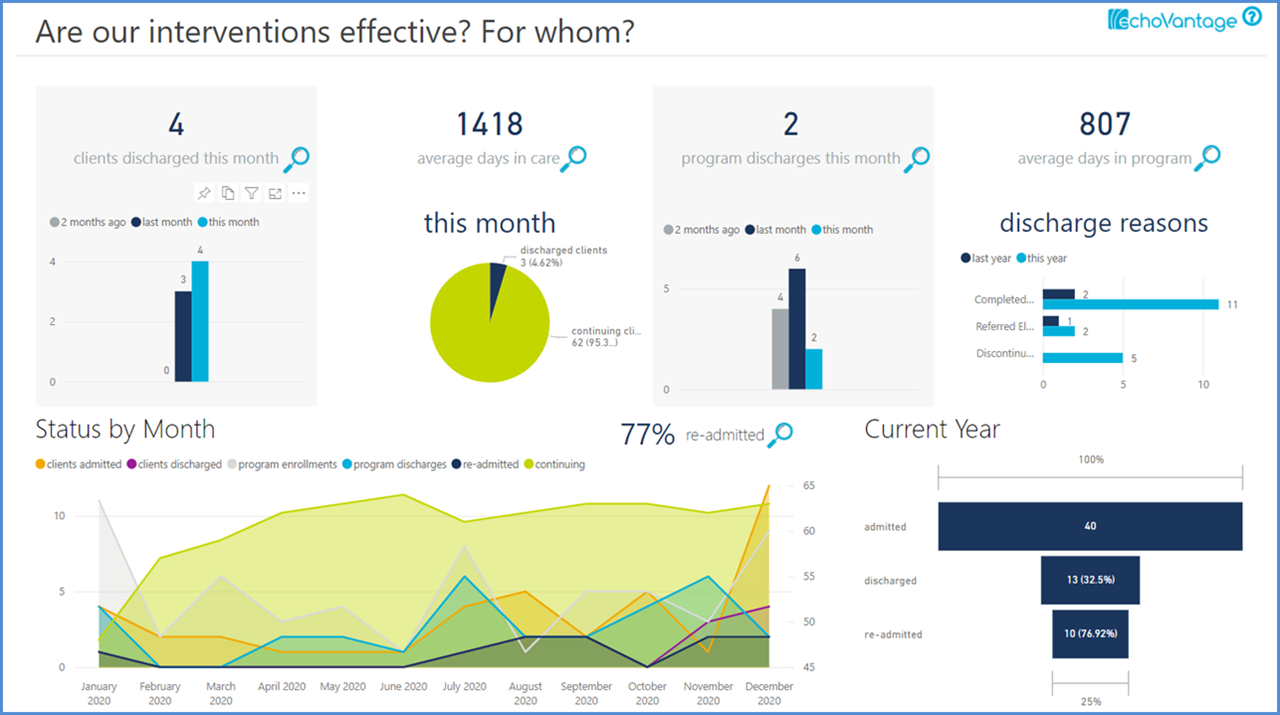
Our Outcomes dashboard provides insights around discharged clients. It reviews discharges and compares days in care to expected time in care, reaching back to admission to disaggregate outcomes based on admission information. The dashboard compares change in medications and diagnoses from admission to discharge, with additional focus on re-admission rates.
Dashboard Catalog
Client Engagement View Screenshots
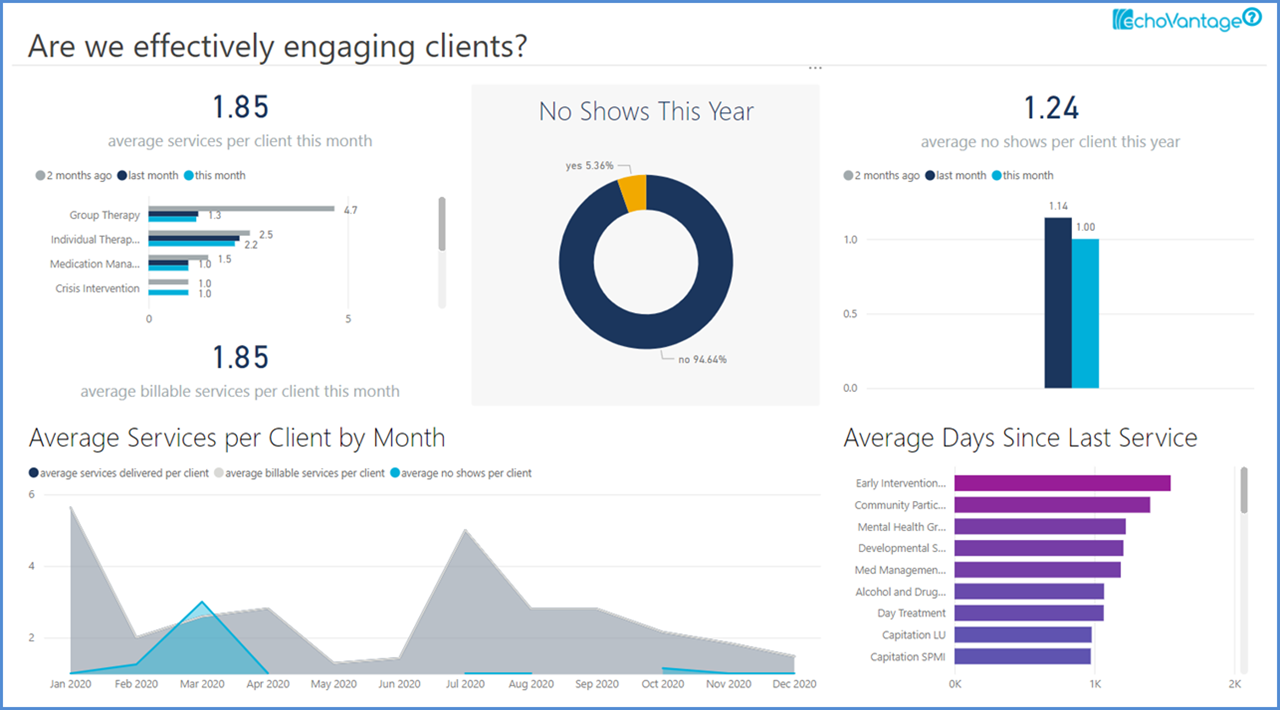
Our Client Engagement dashboard focuses on the timeliness of service provision and examines average services received and missed appointments, along with time between services. It displays the relationship between no-shows and related factors, such as turnover, diagnosis, and timing of appointments.
PHQ-9 Watch Video View Screenshots
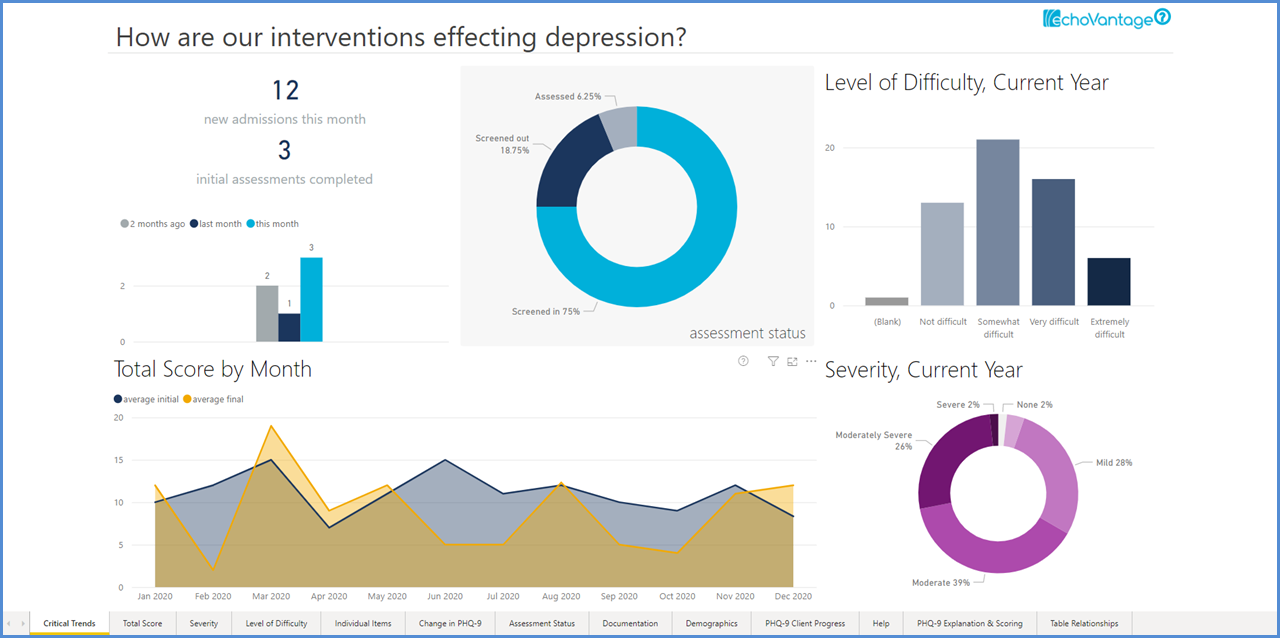
The PHQ-9 dashboard examines how interventions are effecting depression, providing PHQ-9 data such as average total scores, severity categories, level of difficulty, and individual questions, along with whether PHQ-9 assessments have been completed for new admissions. It compares PHQ-9s across time to analyze progress on depression, both at a client-level and an aggregate level. The percent of clients screened in and out of services based on the PHQ-9 is displayed, as is client demographic information in relation to average scores.
Staff Productivity Watch Video View Screenshots
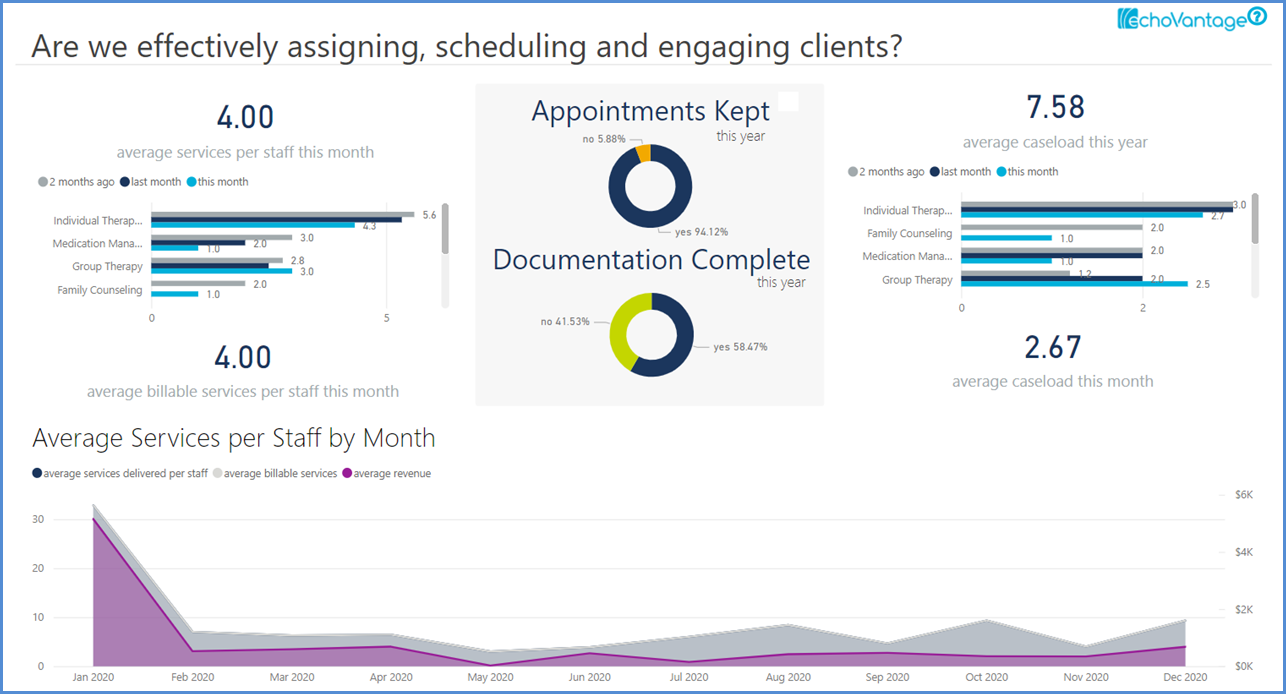
There are two Staff Productivity dashboards available. The first examines caseload distribution and client engagement by staff. It shows average services scheduled and delivered for staff. Users can review days since the last service, revenue, and distances between locations to facilitate drive time efficiency. The second Staff Productivity dashboard uses EchoVantage data to calculate productivity rates, no-show rates, and cancellation rates for staff.
Incidents View Screenshots
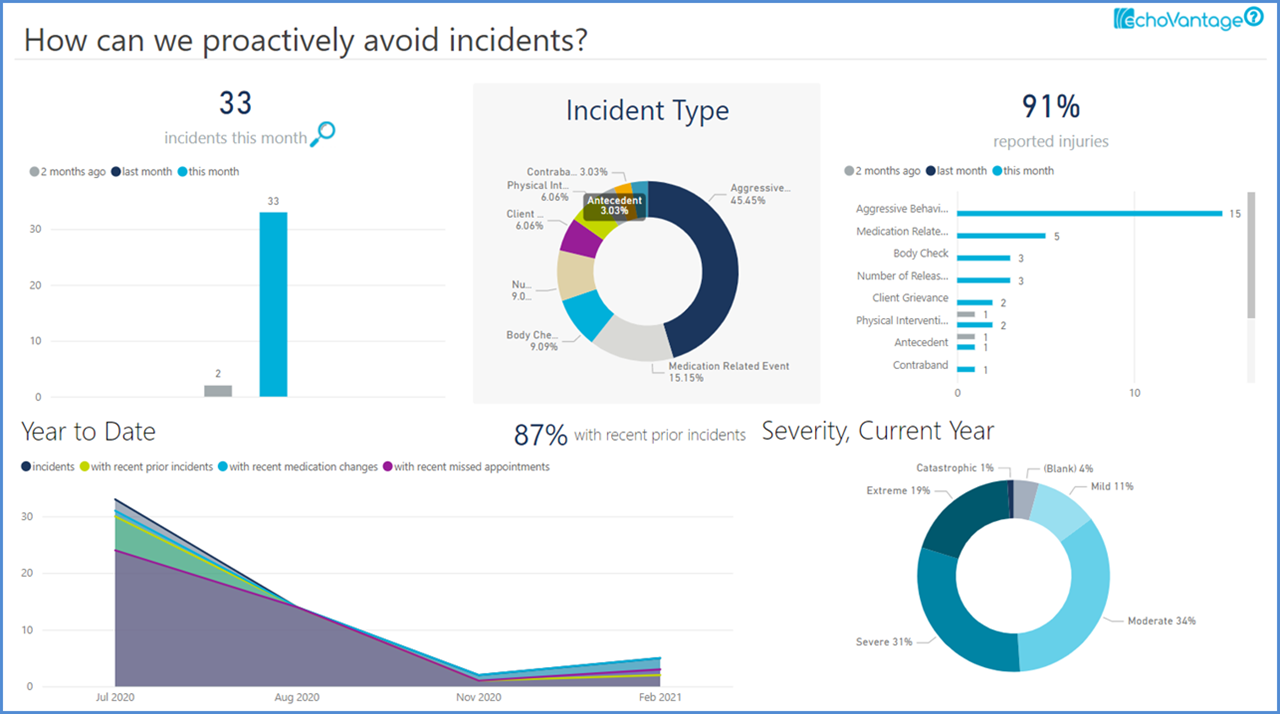
Our Incidents dashboard not only provides incident details but also elucidates potential precipitators, including recent events like other incidents, medication changes, and missed appointments that can be examined to avoid future incidents. Timing of incidents is also be used to identify trends.
Revenue Cycle Management
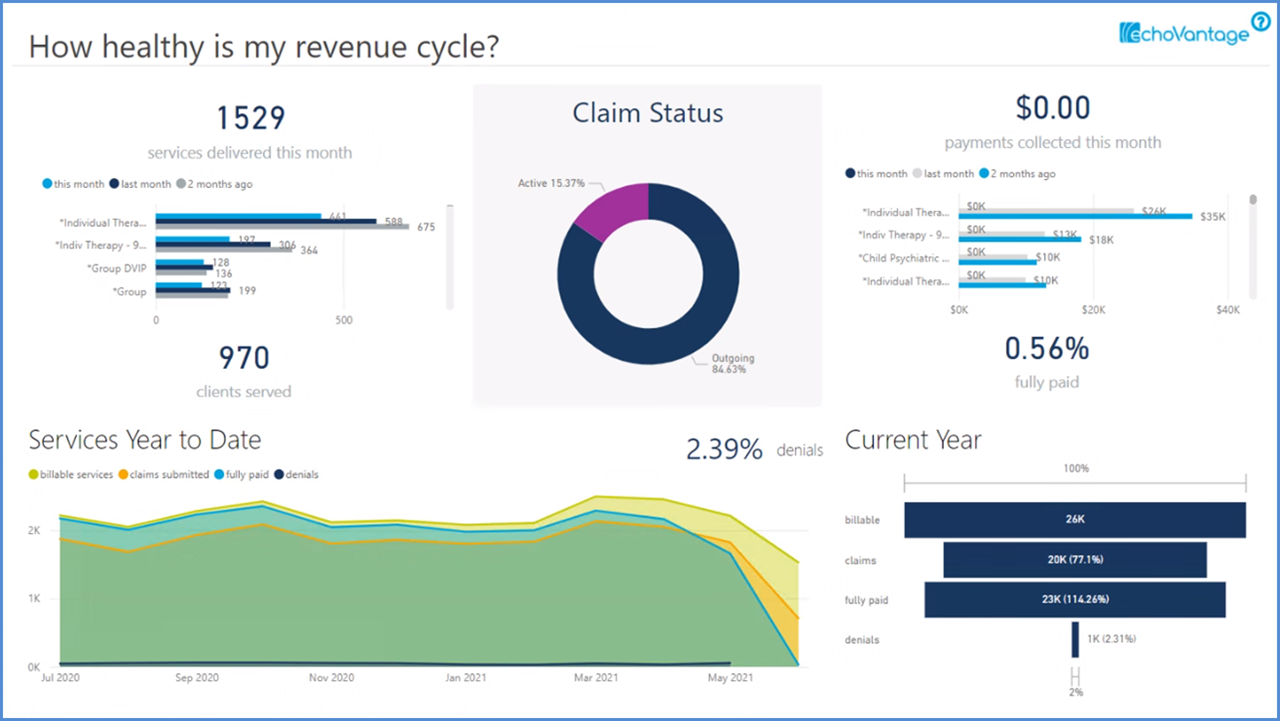
The Revenue Cycle Management dashboard focuses on the health of financial processes, including charges, accounts receivable, collections, and denials management. Transforming financial data into meaningful visualizations, this dashboard helps agencies improve financial outcomes.
Medication Management
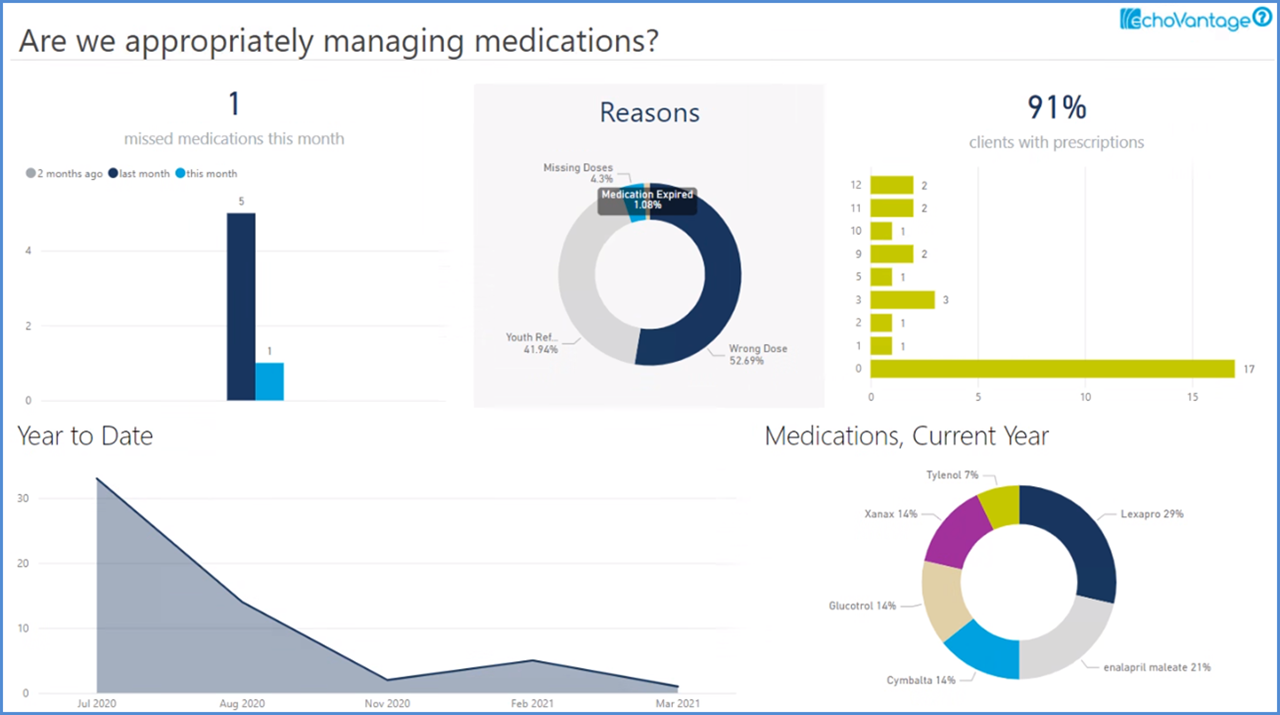
Our Medication Management dashboard provides oversight of data related to medications prescribed. It reviews clients receiving medications by type, overall, and by client and staff. It also examines missed medications and reasons for those, along with documentation, notifications, and client demographics.
Medication Administration
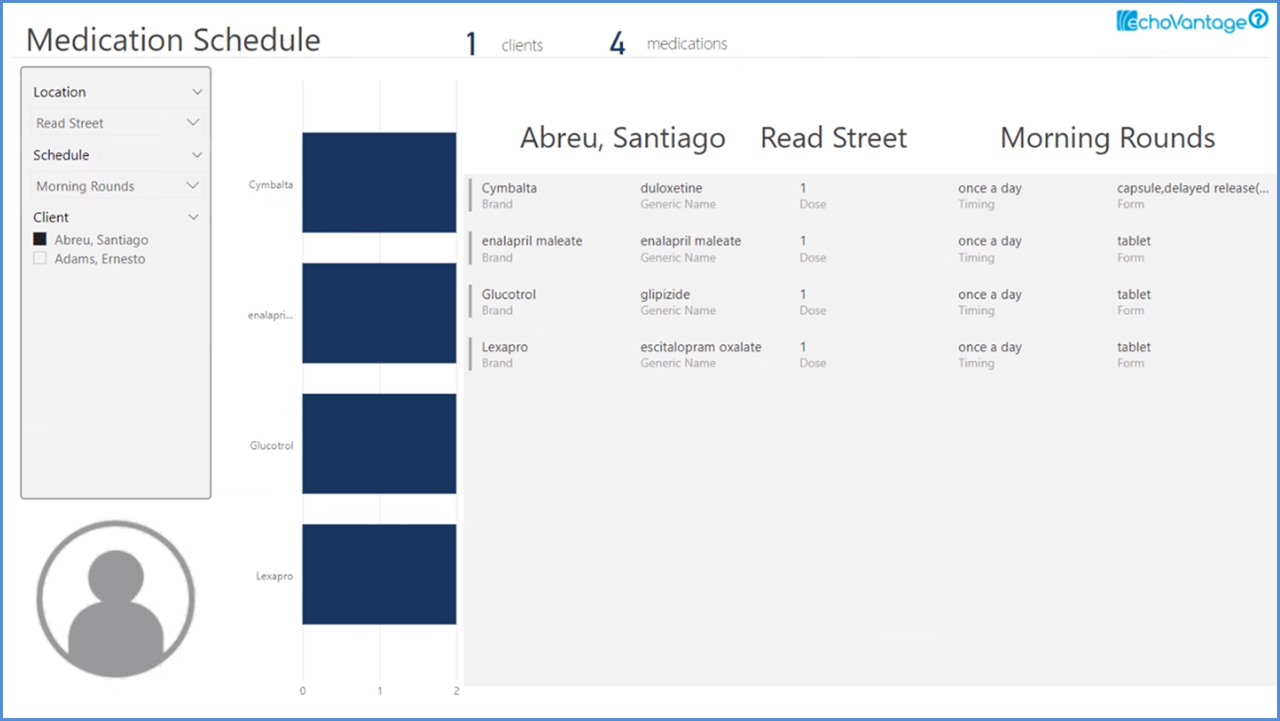
The Medication Administration dashboard provides a way for users to view their clients along with the medications they have been prescribed and details about those medications. This dashboard supports agencies in providing the correct medications to clients at the appropriate times.
Placements (New, Active, Discharges, Services)
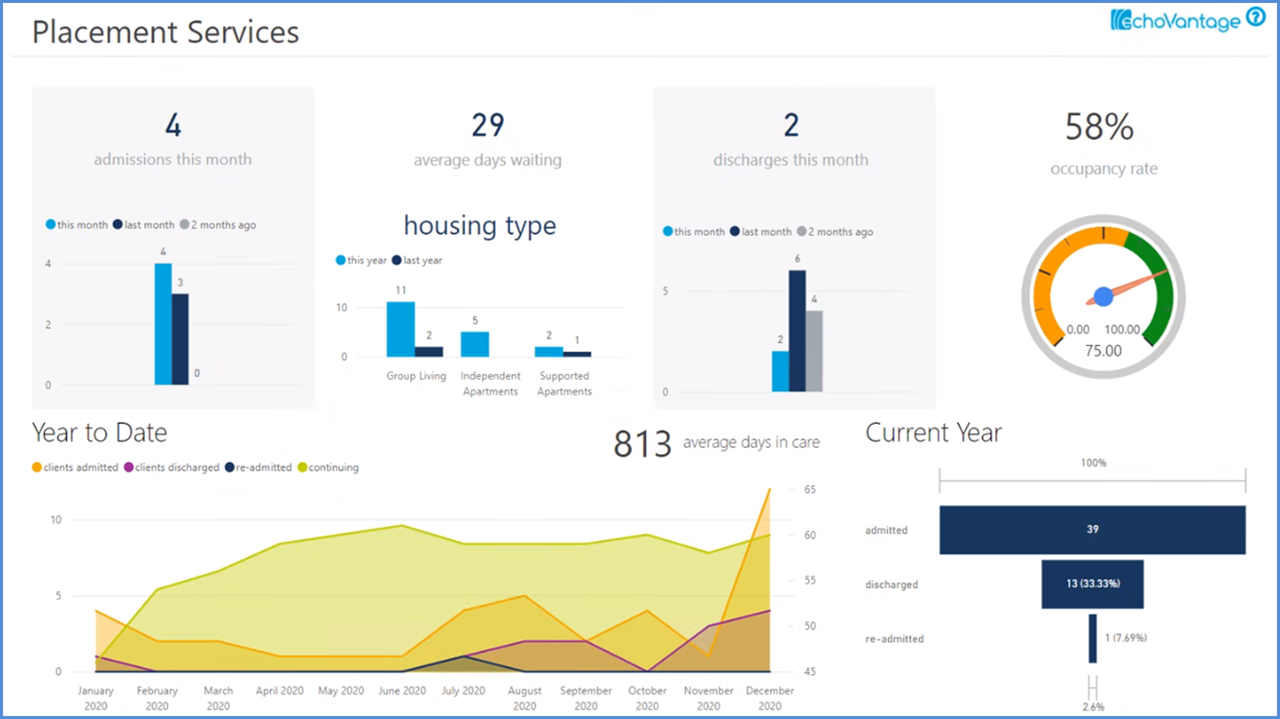
There are four dashboards that examine placement data for in-patient, residential, and foster care services. New Placements reviews placements as clients enter care, while Active Placements displays data relevant during care. Placement Discharges focuses on discharges and disruptions, and Placement Services shows the facilities themselves, including waitlists and occupancy rates.
Hospitalization View Screenshots
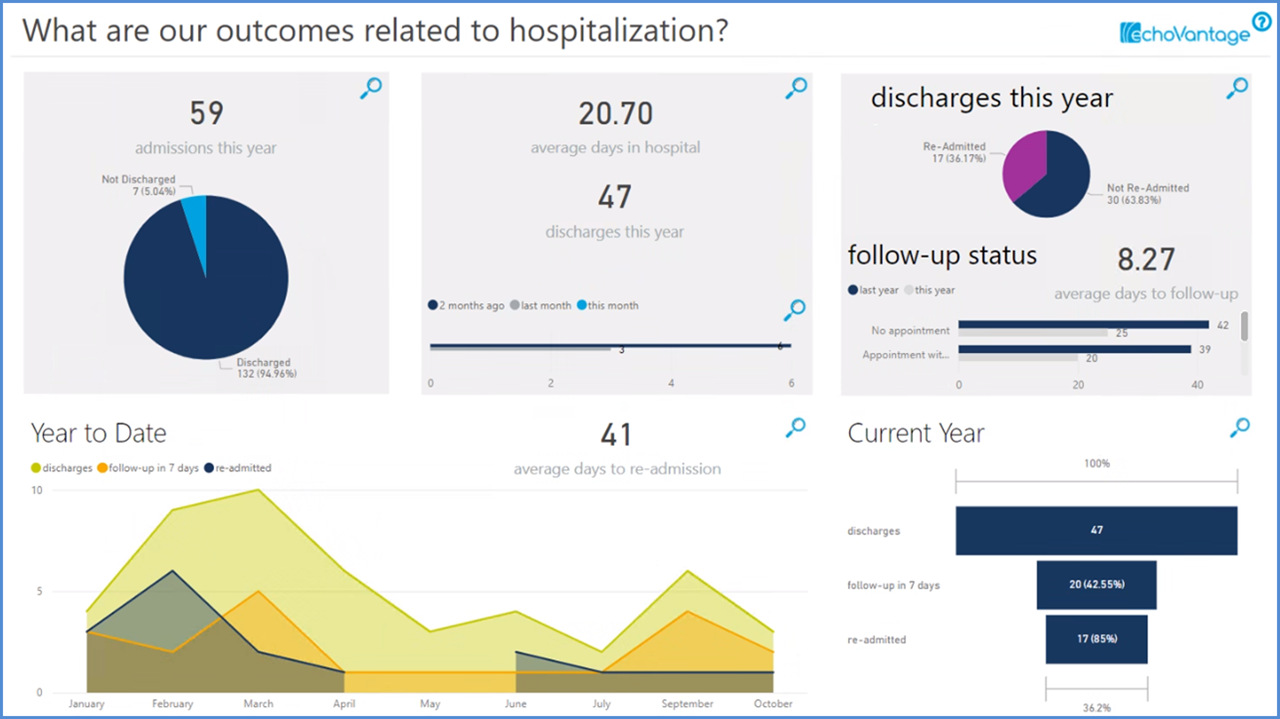
The Hospitalization dashboard reviews information around hospital admissions, discharges, and time in hospital. It also examines re-admissions and timeliness of follow-up, as well as client demographics.
Individual Trends & Progress
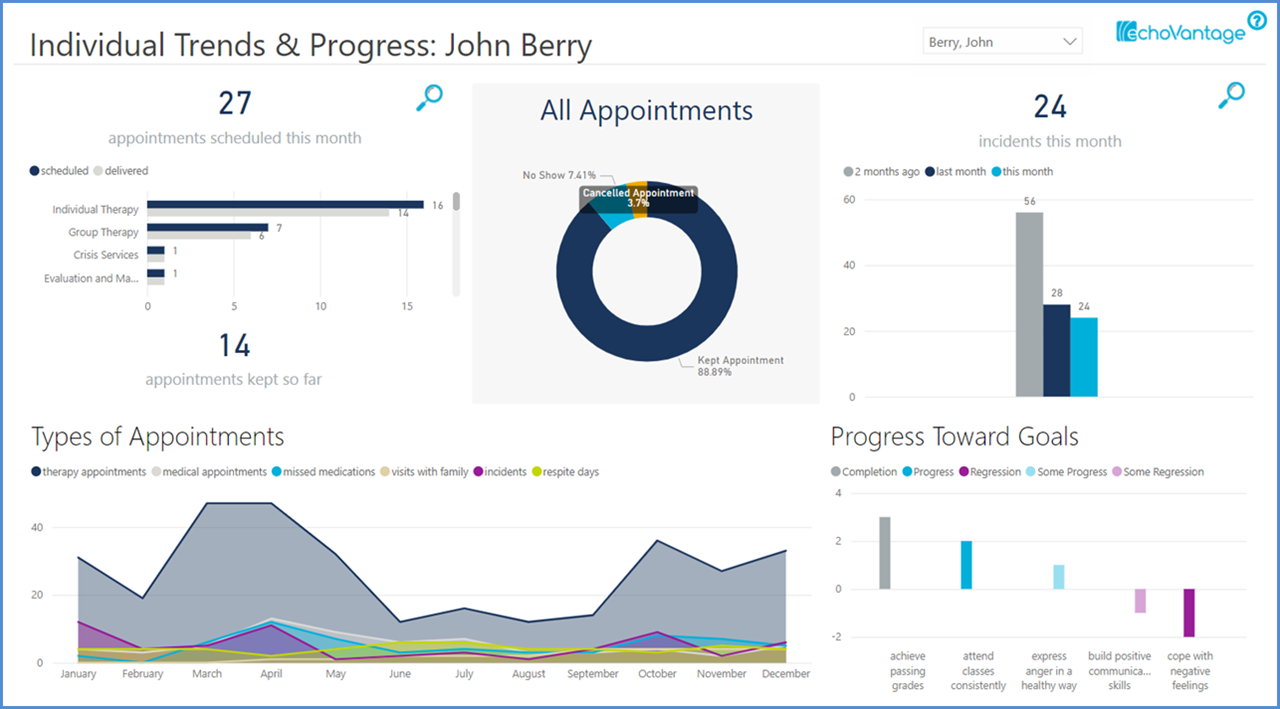
The Individual Trends & Progress dashboard allows users to choose a specific client and view appointments, incidents, and progress toward goals. Assessment information can also be incorporated so that users can view progress toward assessment-specific goals.
Contracted Services View Screenshots
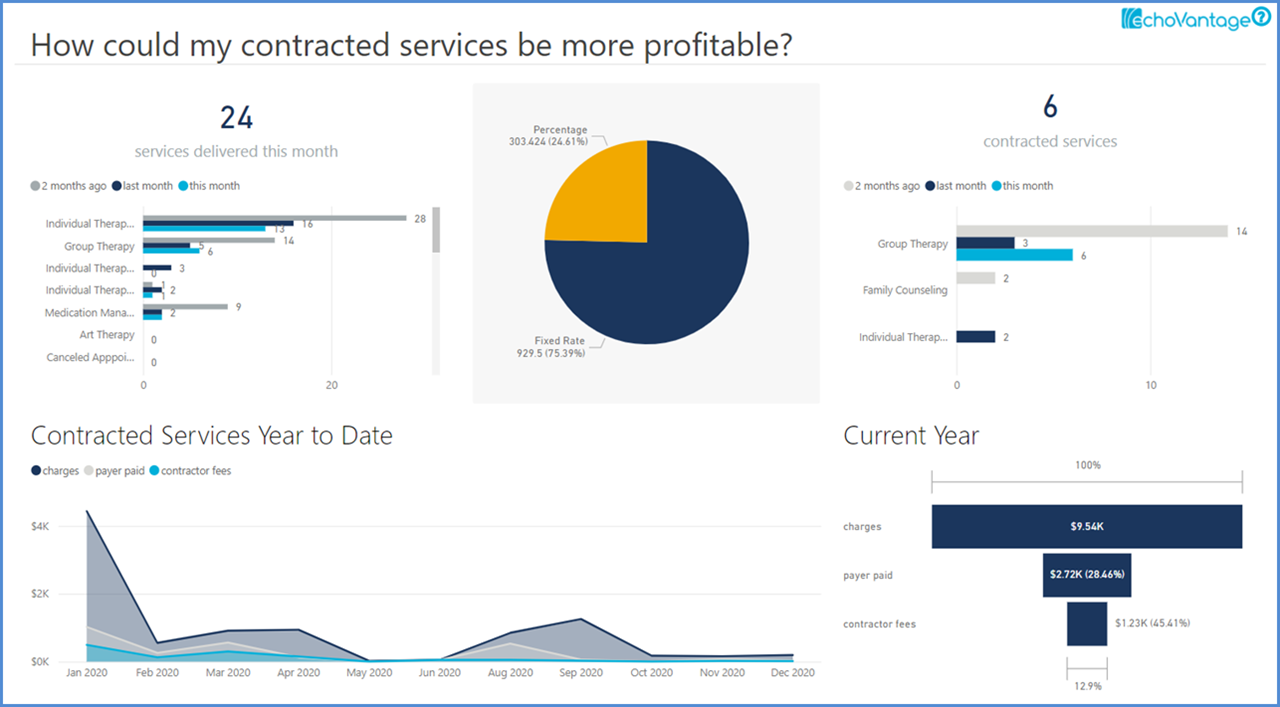
Our Contracted Services dashboard approaches services from a different angle, comparing charges and payer reimbursement with contractor fees. Contracted services are displayed based on service information and staff and broken down by rate type so that fixed-rate vs. fees based on percentages can be compared.
Child & Adolescent Needs and Strengths (CANS) View Screenshots
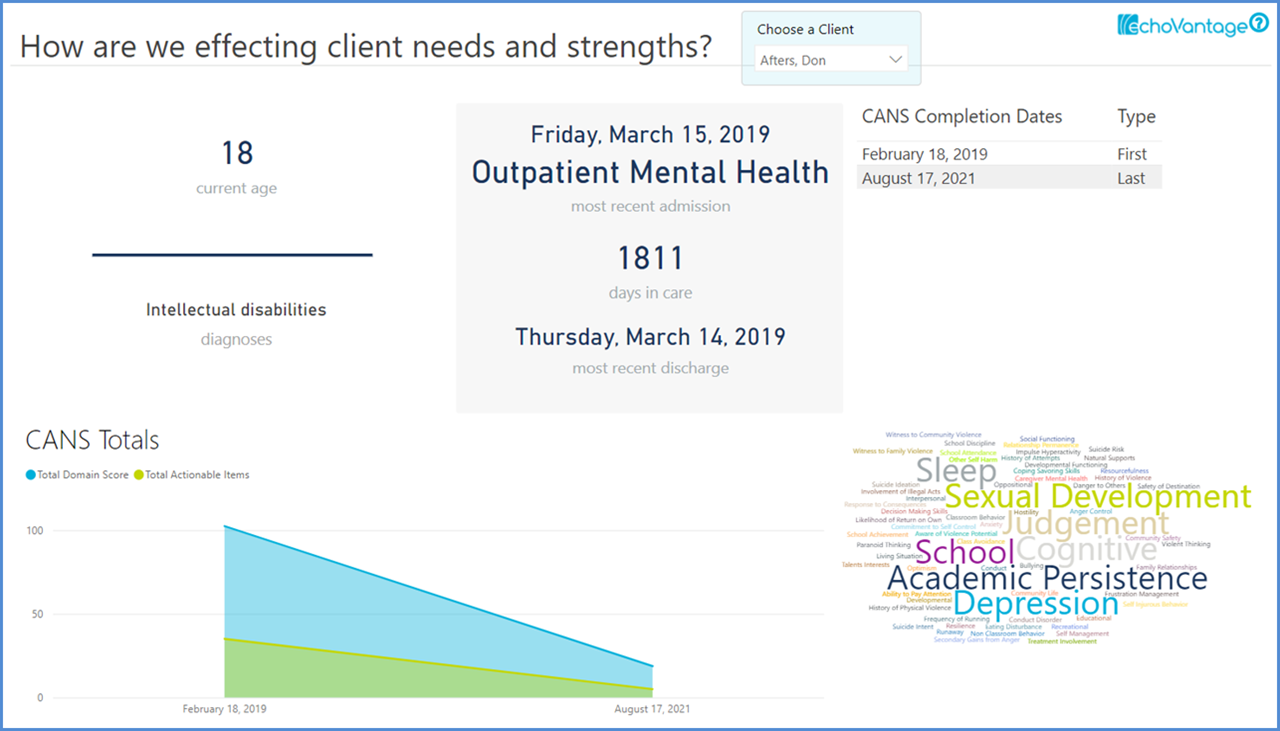
Our CANS dashboard provides visualizations to examine how programs are effecting individual client needs and strengths. Users can choose a specific client and view progress over time related to CANS domain scores, modules, and actionable items. Additional CANS dashboards are in development that will review CANS data across cohorts in accordance with Praed Foundation guidelines.
Social Determinants of Health View Screenshots
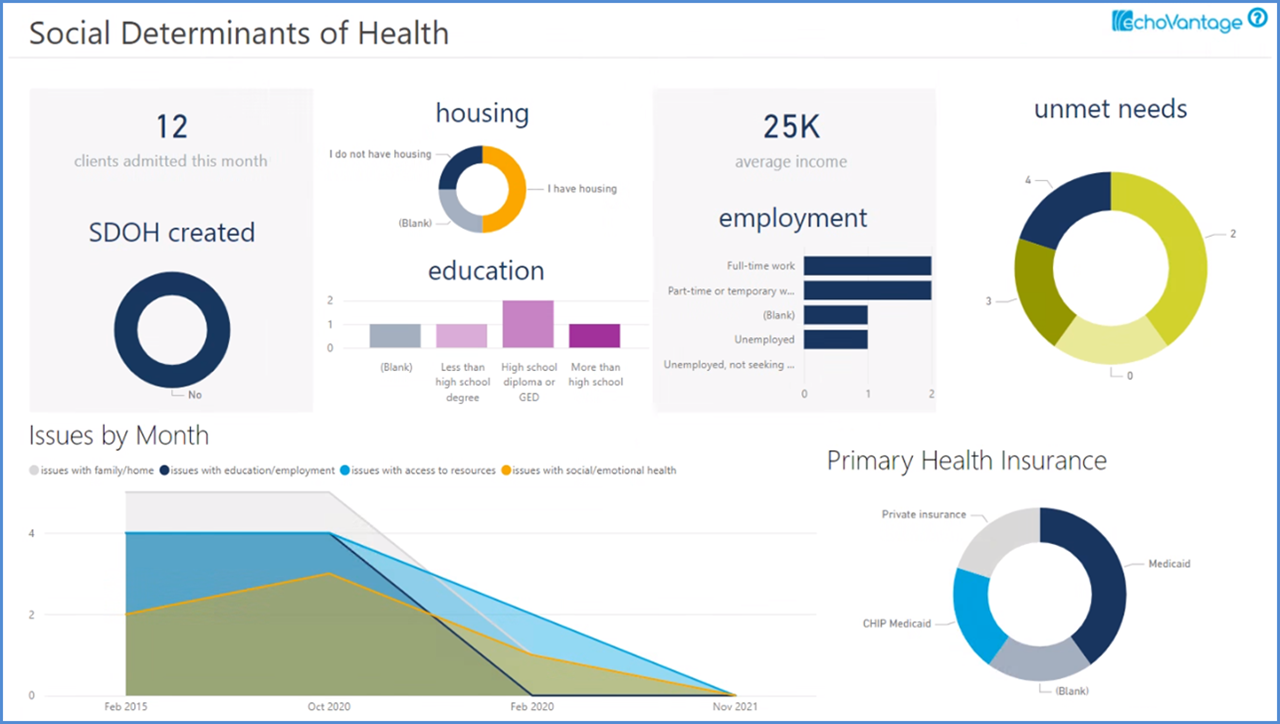
Our Social Determinants of Health dashboard provides visualizations that help agencies identify environmental conditions that affect client health, functioning, and quality of life outcomes and risks. Included are metrics around Family & Home, Education & Employment, Resources, and Social & Emotional Health.
Adverse Childhood Experiences (ACEs) View Screenshots
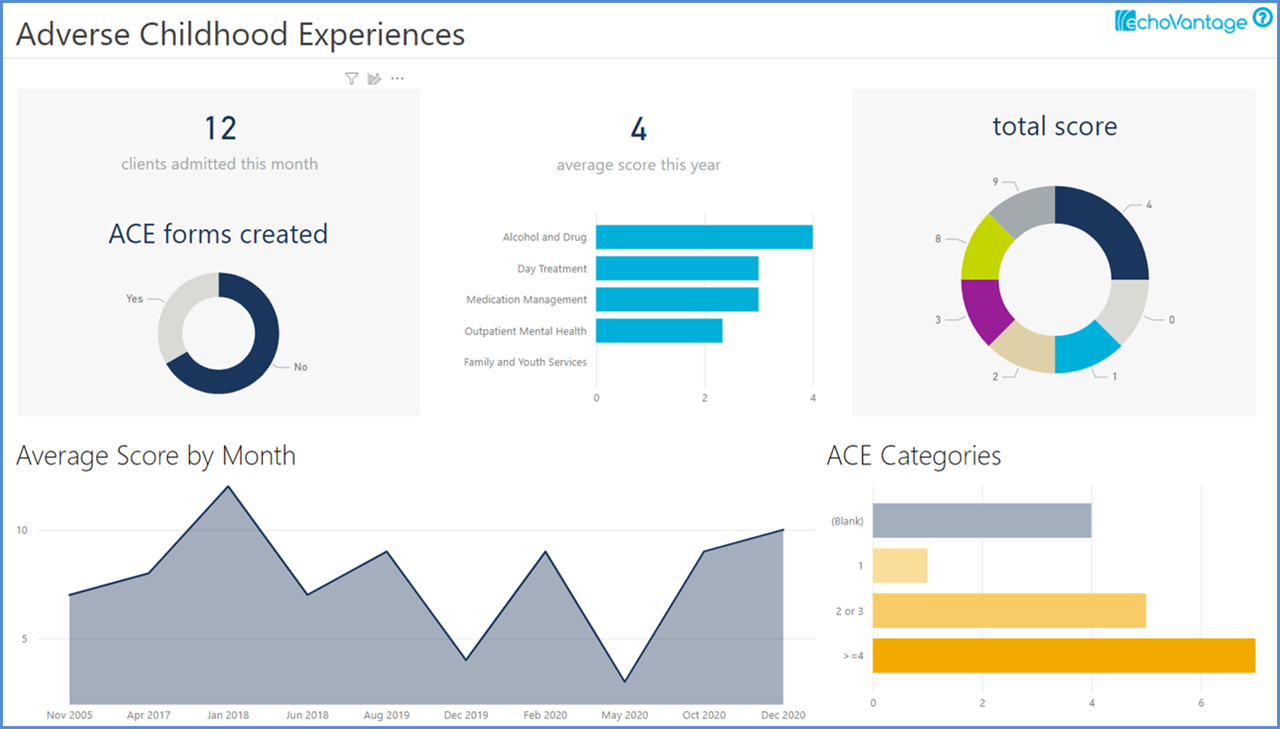
The Adverse Childhood Experiences (ACEs) dashboard allows users to explore the ACEs of clients in their care as well as whether ACE documentation has occurred. Average and total scores as well as score categorizations are shown across time, by program, and for client demographics.
Form Signatures Watch Video View Screenshots
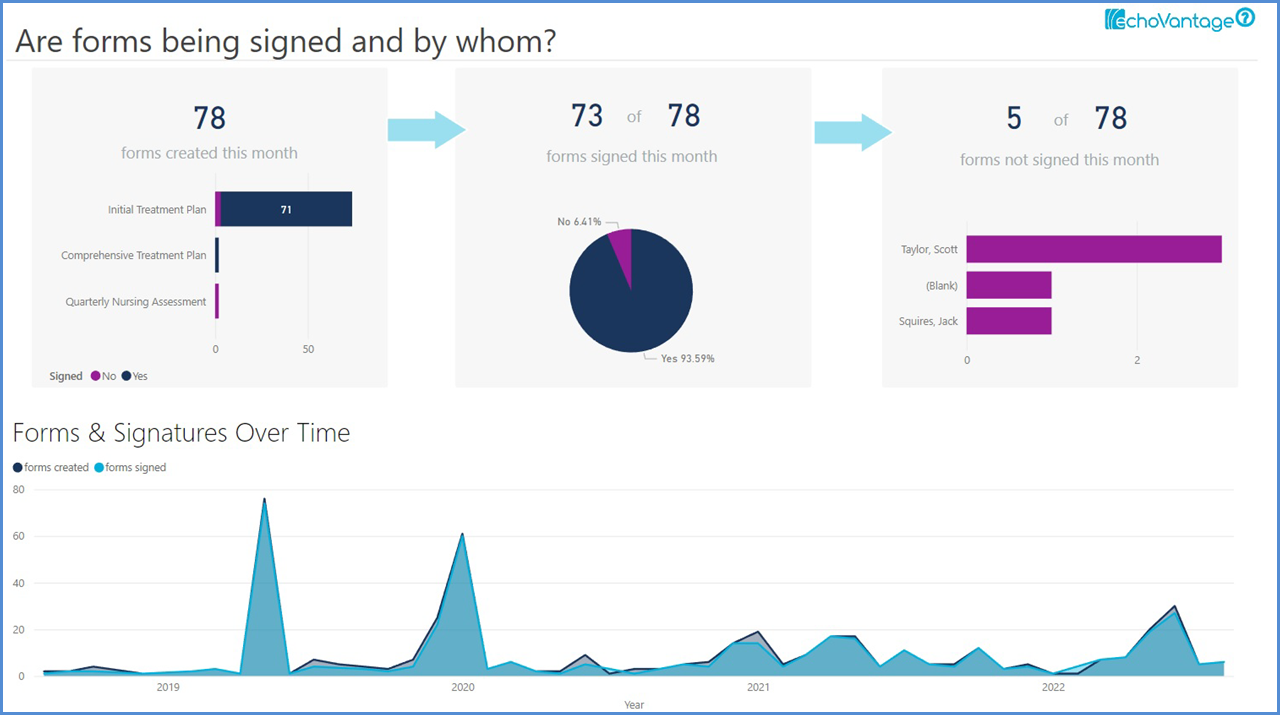
You may be familiar with our Documentation dashboard. It is included with EchoVantage and provides ways to view whether service-related documentation on progress notes is complete. Our Form Signatures dashboard is similar in that it provides information about whether signatures have occurred, but it focuses on forms that are not necessarily associated with services. The dashboard provides ways of analyzing whether forms are getting signed, by whom, and which signatures are missing. You can choose to include any form in EchoVantage.
Outstanding Alerts Watch Video View Screenshots
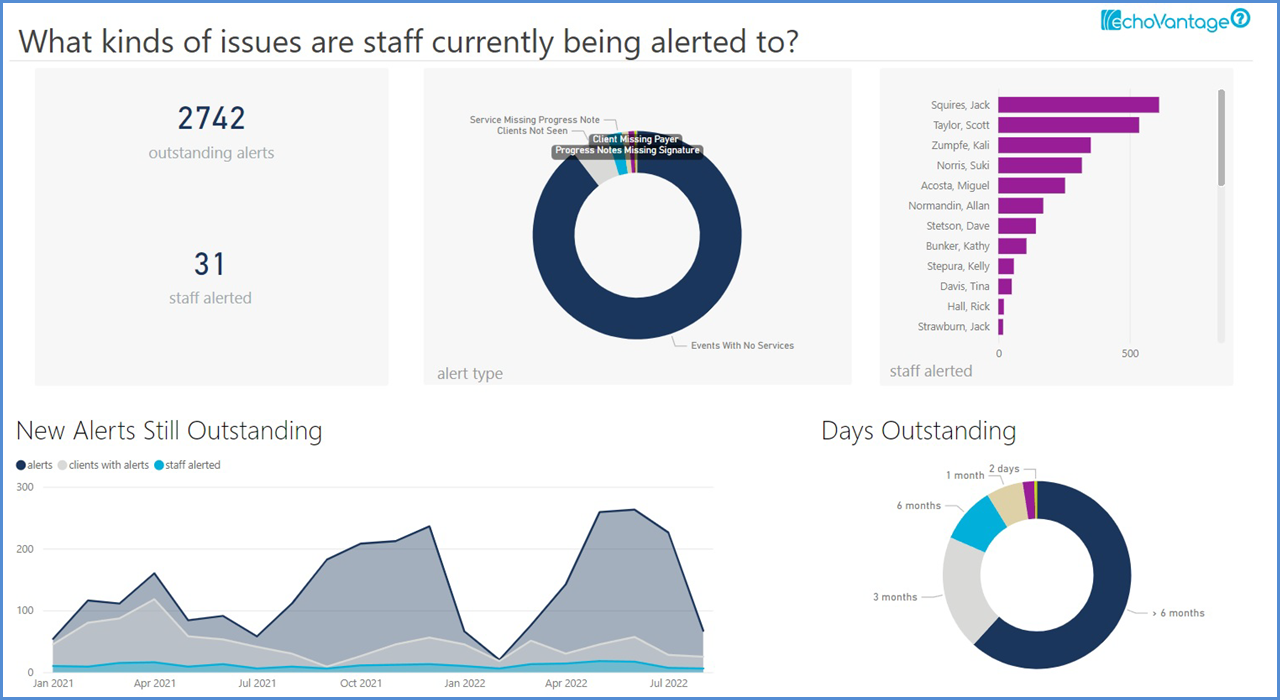
The Outstanding Alerts dashboard focuses on alerts that are generated in EchoVantage. Once you have set up alerts in EchoVantage (see http://webhelp.echoehr.com/search?keywords=alerts for more information), the dashboard will allow you to see what kinds of alerts are currently outstanding, which staff and clients are associated with those alerts, and how long they've been outstanding.
DLA-20 Watch Video View Screenshots
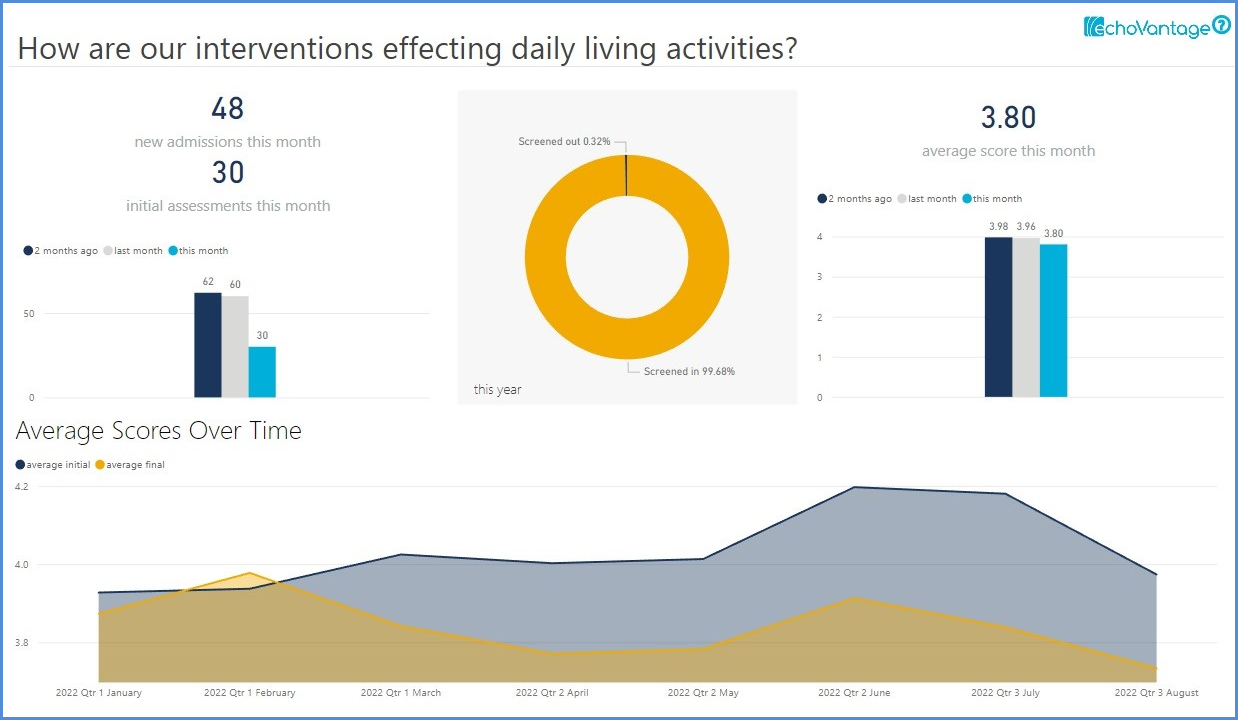
The DLA-20 dashboard examines how interventions are effecting daily living activities, providing DLA-20 data such as average & total scores, severity categories, and responses to individual questions, along with whether DLA-20 assessments have been completed for new admissions. It compares DLA-20s across time, both based on a time frame and for admission and discharge cohorts, to analyze progress on daily living activities, both at a client level and an aggregate level. The percent of clients screened in and out of services based on the DLA-20 is displayed, as is client demographic information in relation to average scores.
GAD-7 Watch Video View Screenshots
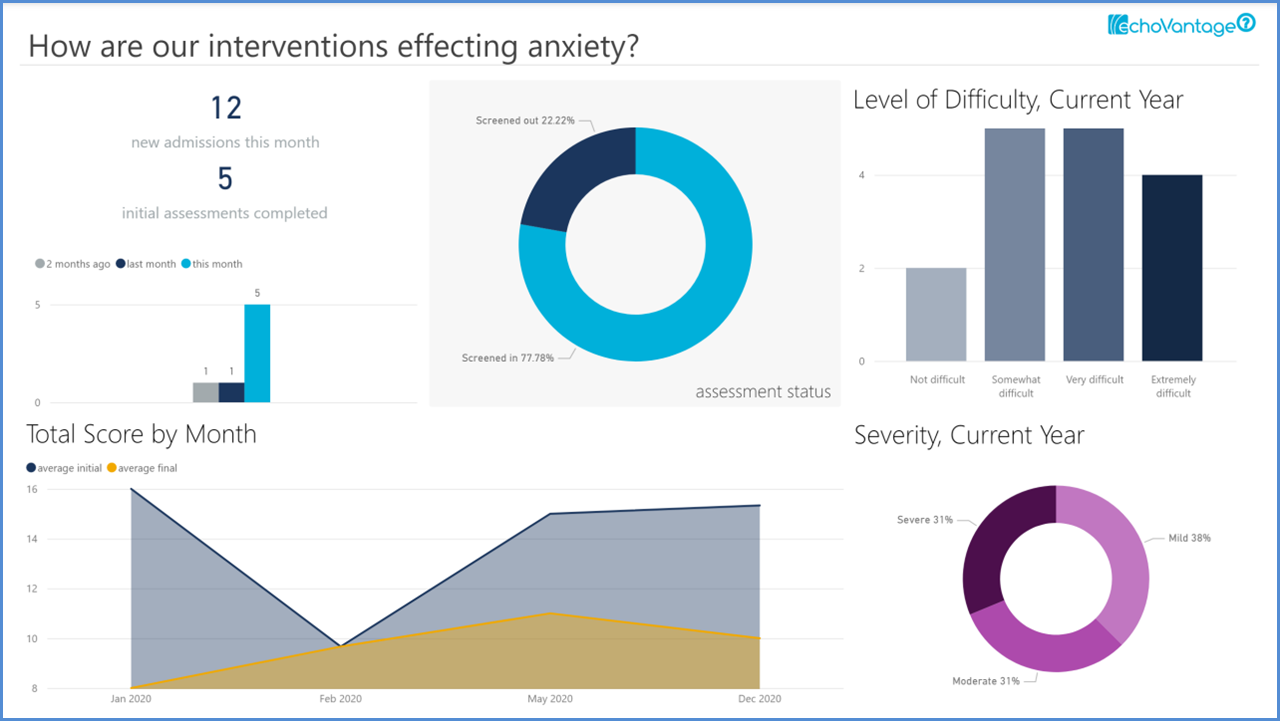
The GAD-7 dashboard examines how interventions are effecting anxiety, providing GAD-7 data such as average & total scores, severity categories, level of difficulty, and responses to individual questions, along with whether GAD-7 assessments have been completed for new admissions. It compares GAD-7s across time, both based on a time frame and for admission and discharge cohorts, to analyze progress on anxiety, both at a client-level and an aggregate level. The percent of clients screened in and out of services based on the GAD-7 is displayed, as is client demographic information in relation to average scores.
Form Compliance Watch Video View Screenshots
You may be familiar with our Documentation dashboard. It is included with EchoVantage and provides ways to view whether service-related documentation on progress notes is complete. Our Form Compliance dashboard is similar in that it provides information about whether forms have been created and signed, but it focuses on forms that are not necessarily associated with services. The dashboard provides ways of analyzing whether forms are getting created and signed, by whom, and what documentation is missing. You can choose any form in EchoVantage to include, and you can identify when forms are coming due. For example, you might include an initial treatment plan that is due within 30 days of intake and a comprehensive treatment plan that is due every 60 days after the previous plan.
